S-Curve Excel Template
18 March 2025Table of Contents
S-Curve Excel Template
The S-Curve is a powerful tool in project management used for tracking progress, forecasting performance, and ensuring projects stay on schedule and within budget. Whether you are a construction manager, an engineer, or a project planner, understanding the S-Curve can significantly enhance your project tracking and decision-making capabilities.
In this article, we will explore the fundamentals of the S-Curve, its importance in project management, and provide you with a free Excel template to simplify your project tracking.
What is an S-Curve?
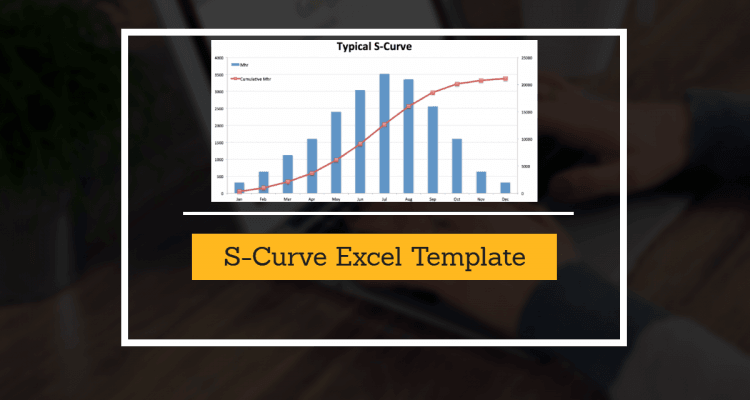
An S-Curve is a graphical representation of cumulative progress over time. It derives its name from its characteristic “S” shape, which reflects slow progress at the beginning, rapid growth in the middle, and leveling off towards the project’s completion.
The three main phases of an S-Curve include:
-
Initial Phase – Slow growth due to planning, resource allocation, and mobilization.
-
Growth Phase – Rapid progress as major tasks are completed and work reaches peak productivity.
-
Maturity Phase – The completion stage where progress slows down as the project nears closure.
Importance of the S-Curve in Project Management
The S-Curve provides key insights into project performance by offering the following advantages:
-
Progress Tracking: Helps visualize project progress in real-time.
-
Performance Analysis: Compares actual vs. planned progress.
-
Forecasting: Predicts future trends based on historical data.
-
Budget Control: Identifies cost overruns and inefficient resource allocation.
-
Decision Making: Helps project managers take proactive measures to avoid delays.
Types of S-Curves
Different types of S-Curves are used depending on the project’s needs:
-
Manpower S-Curve: Tracks workforce usage over time.
-
Cost S-Curve: Monitors cumulative project expenditure.
-
Baseline vs. Actual S-Curve: Compares planned vs. real progress.
-
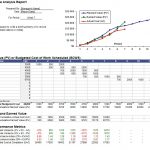
Earned Value S-Curve: Evaluates performance using Earned Value Management (EVM).
Free Excel S-Curve Template
To simplify your project tracking, we offer a free S-Curve Excel template that allows you to:
-
Input project data effortlessly.
-
Generate real-time progress graphs.
-
Compare planned vs. actual performance.
-
Analyze trends and forecast future progress.
Download Free S-Curve Excel Template
How to Use the Excel Template
-
Download the Excel file using the link above.
-
Enter your project data including dates, budget, and progress percentage.
-
View automatically generated S-Curve charts reflecting your project’s progress.
-
Compare planned vs. actual values to analyze deviations.
-
Adjust your project plan based on insights derived from the graph.
Conclusion
The S-Curve is an indispensable tool for project managers, helping to track progress, optimize resources, and ensure timely project completion. By using our free Excel S-Curve template, you can enhance your project monitoring efficiency and make data-driven decisions. Download now and streamline your project management today!
Source: bibloteka.com


